

/ Feature
Cash Insights
Understand why your cash moves — not just how much you have in real time. From balances to explanations, with visuals you can trust and numbers you can verify
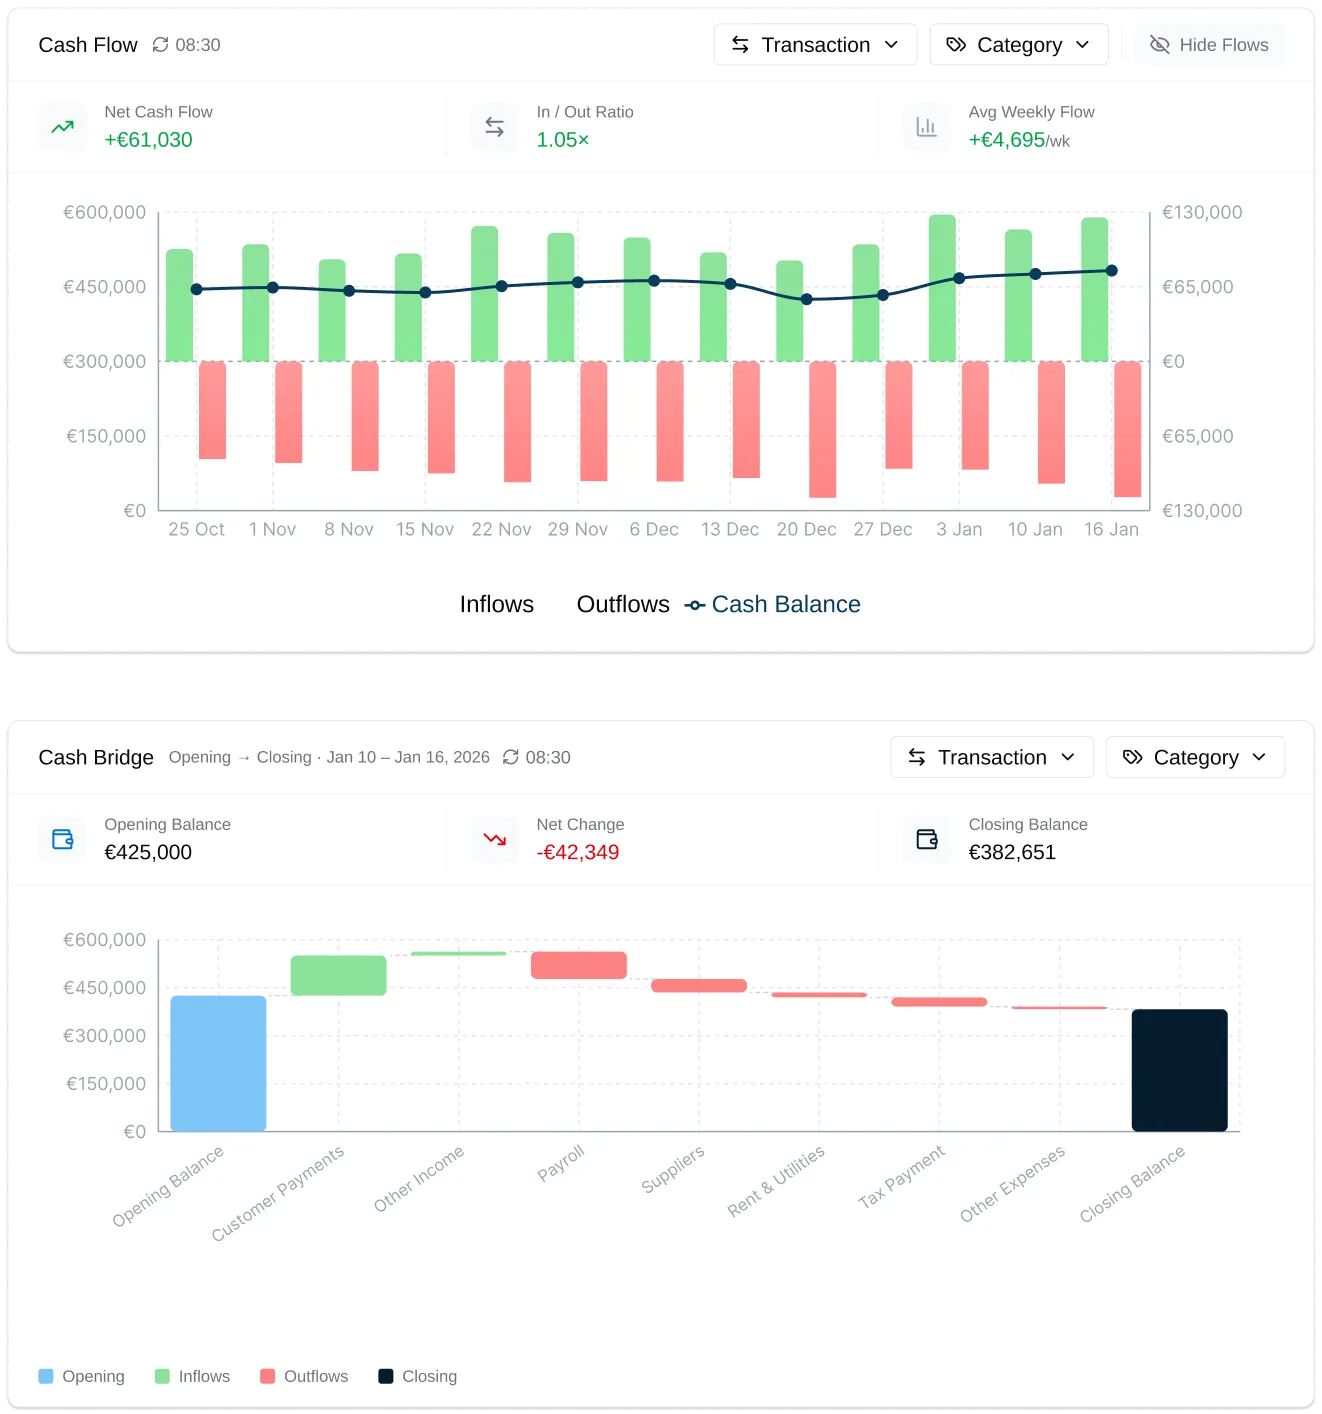
Moving from “what happened” to “why it happened” — with visual, explorable cash analytics built for decision-making, not reporting




/ Cash insights
See how cash evolves over time
Orcheo visualizes your cash as a continuous timeline — combining position, inflows, and outflows into a single, intuitive view that reflects real operational activity

Dynamic Scaling: Switch between daily, weekly, and monthly views
Inflow/Outflow Evolution: Spot the exact moment when your OpEx began to outpace your Revenue
Global Filtering: Slice the charts by specific bank accounts or entities to isolate “problem areas”
Immediate understanding of trends and inflection points
This is the fastest way to understand what actually drove your cash position and when it changed
Get Started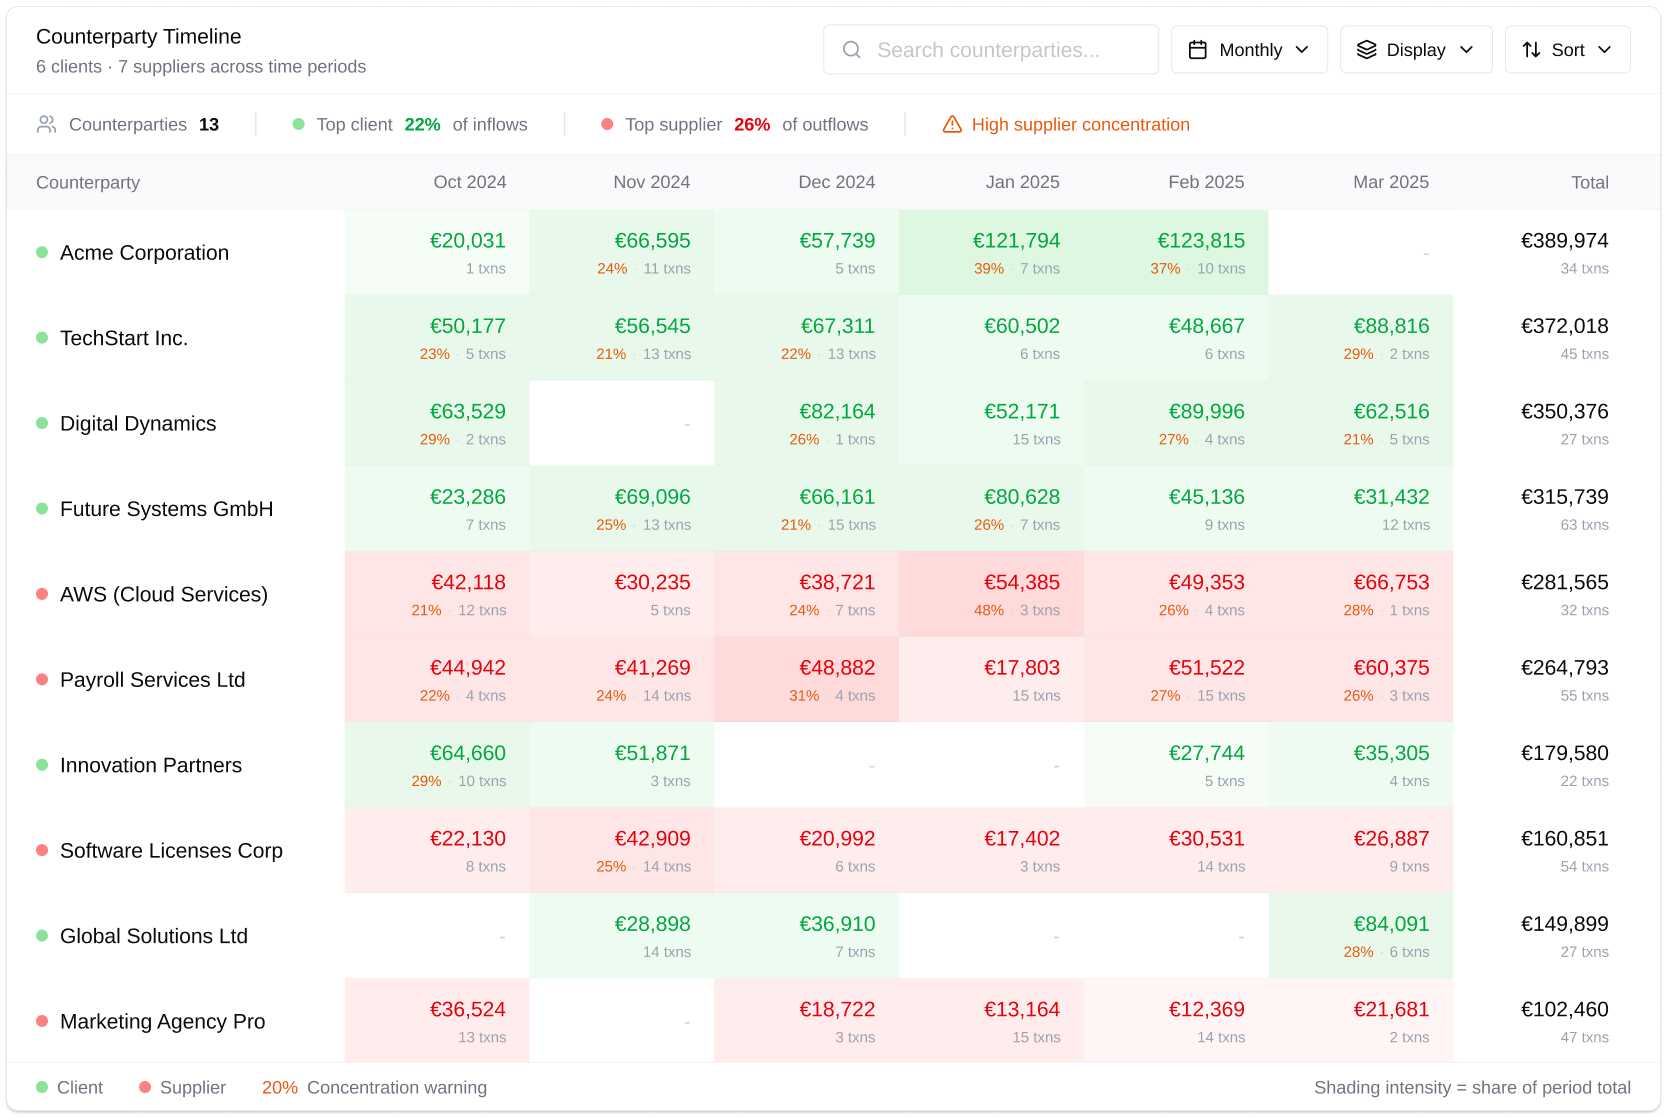
/ cash insights
From chart to transactions, instantly
Charts shouldn’t be dead ends. Every bar, line, and bridge segment is a portal to your data with no loss of detail
One-Click Auditing: Click any period on the timeline or any bar in the bridge to instantly see the underlying transaction ledger
Aggregated Transactions: See the “total” for a category, then expand it to see every individual wire transfer and card swipe contributing to that total
Break down by category, entity, or counterparty
Full traceability, no hidden calculations
Total transparency. If a number looks “off,” you can prove why it’s there in seconds without exporting data
Get Started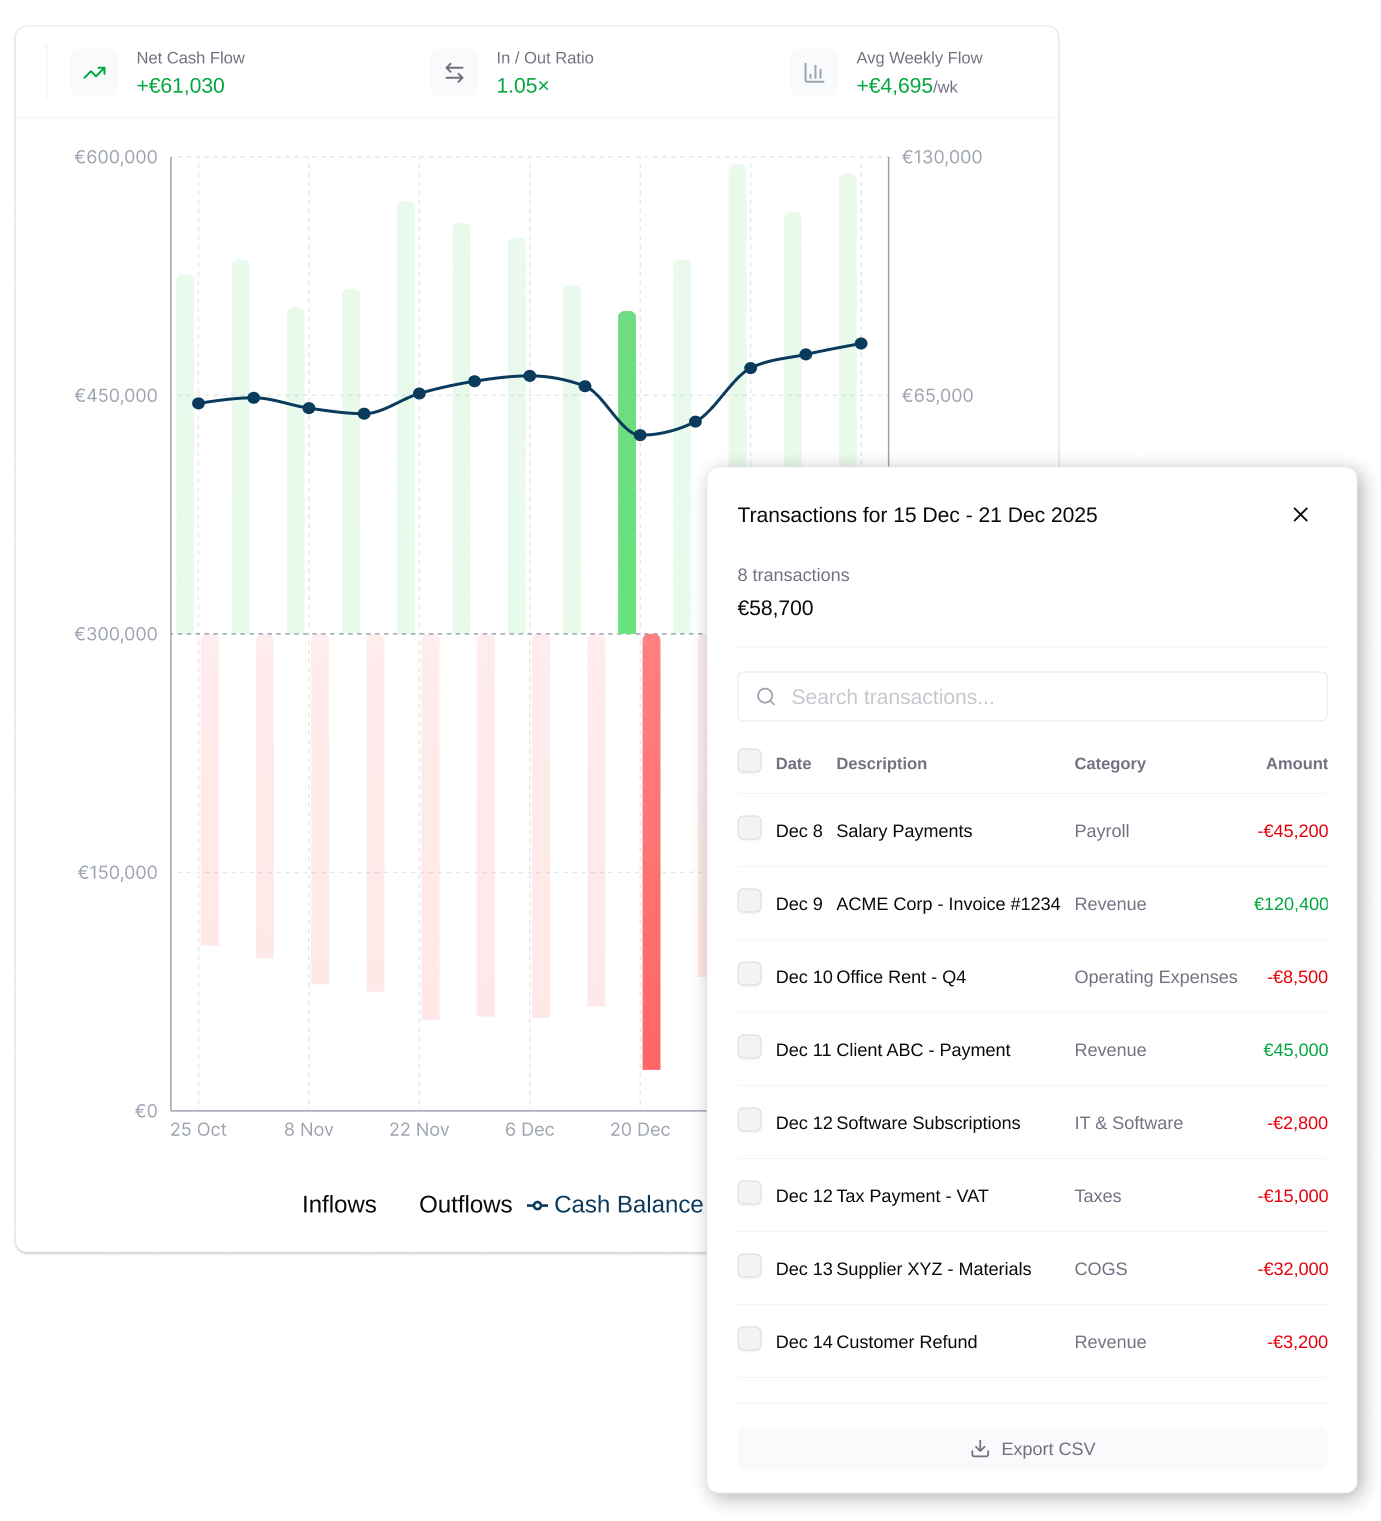
/ cash insights
Understand who drives your cash
Cash movements are not just categories — they are relationships. Orcheo shows which clients, suppliers, and counterparties drive your inflows and outflows, so you can see where your cash really comes from and where it goes
Counterparty Overview: See the full list of clients, suppliers, and recurring counterparties behind your cash movements
Inflows by Source: Identify which clients or revenue sources contribute most to incoming cash
Outflows by Beneficiary: Understand where cash leaves the business and which suppliers absorb the largest share
Concentration Signals: Spot dependency on a key client or excessive exposure to a supplier
Timeline Analysis: Track how each counterparty evolves over time
Know who matters most to your cash — before concentration becomes risk
Get Started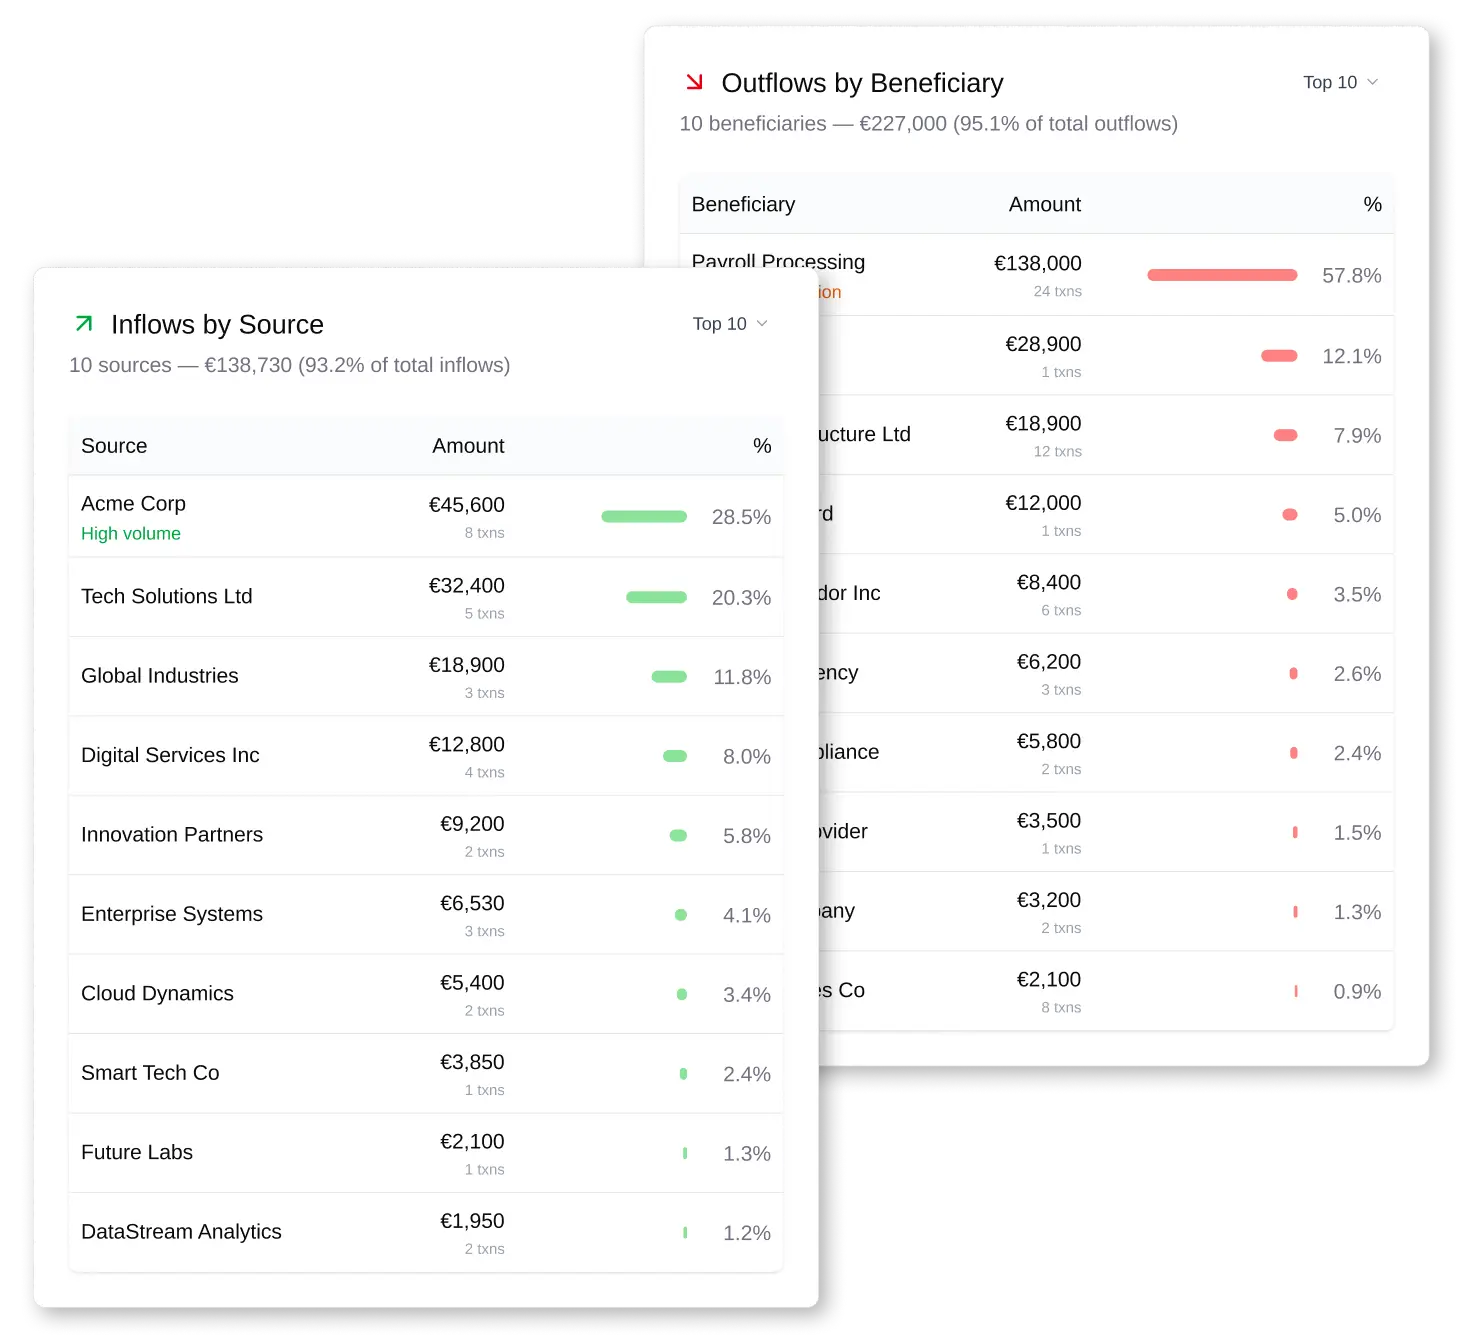
/ cash insights
Analytics designed for decisions
Cash Flow Analytics in Orcheo isn’t about pretty charts — it’s about enabling better decisions, faster with shared financial context
Spot abnormal cash movements instantly
Identify structural vs one-off effects
Compare periods with consistent logic
Speak the same language across finance, founders + boards
No interpretation gap between finance and leadership
Get Started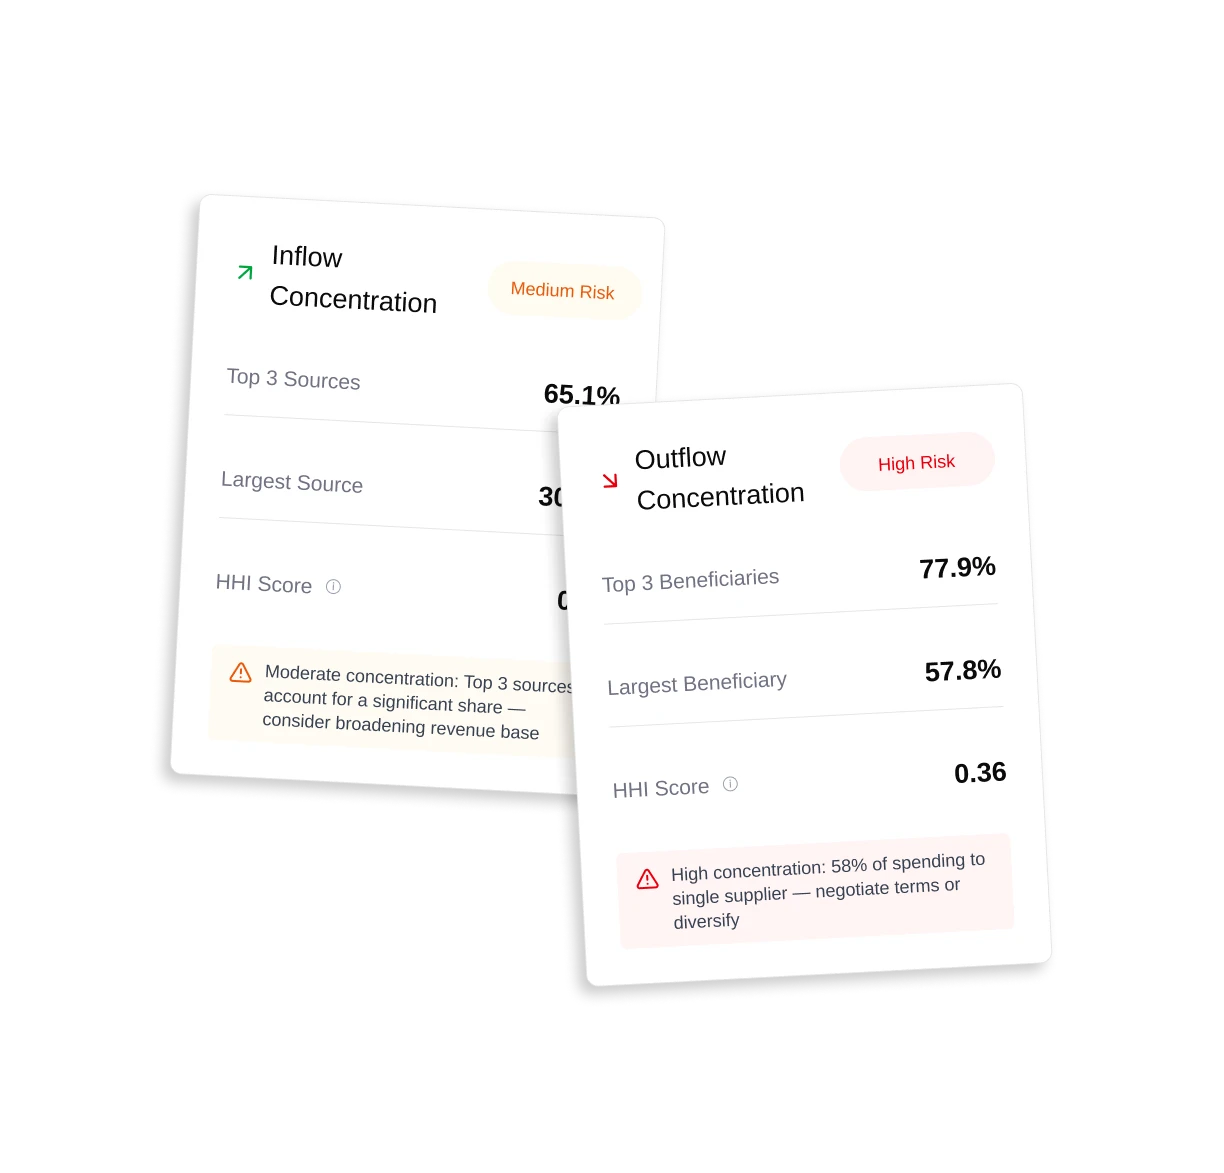
Cash visibility tells you where you are. Cash insights tell you why you’re there
Orcheo turns raw cash movements into clear, explainable intelligence — continuously connected to underlying transactions — ready for action, not just reporting
Orcheo turns raw cash movements into clear, explainable intelligence — continuously connected to underlying transactions — ready for action, not just reporting
/ FAQ
Everything You Need to Know
How can Orcheo show if a project is really profitable?

Orcheo compares project revenue with all related costs to calculate accurate margins, making it easy to see true profitability.
Can I compare profit across projects or clients?
Yes. You can compare multiple projects or clients to identify strong performers and areas that may require pricing or cost adjustments.
What costs can I include in my project analysis?
You can include direct costs, staff time, contractor fees, materials, tools, software and allocated overheads.
How does project profitability link to my overall cash flow?
Orcheo connects project revenue and expenses to your cash flow model, allowing you to see how project timing affects your cash position.
/ Orcheo AI
Connect once. Understand everything
.svg)
Connect your banks securely
Understand what happened
Predict what comes next
Stay in control as your business grows
No spreadsheets. No manual work
Connect → AI → Insights → Control